Bank Mutual Fund Programs vs Justwealth
Justwealth has been providing Justice to Canadian investors for over 10 years.

Do fees make a difference?*
Compare Justwealth’s portfolios using low-cost Exchange Traded Funds (ETFs) versus the high-fee mutual fund portfolios offered by Canada’s big banks. Warning, you may find the results disturbing!
| Asset Allocation: 80% Fixed Income/20% Equity | 1 yr | 3 yr | 5 yr | 10 yr | Annual fees |
|---|---|---|---|---|---|
| % | % | % | % | % | |
| Justwealth Global Conservative Growth Portfolio | 2.97 | 9.57 | 4.10 | 4.64 | 0.70 |
| BMO SelectTrust Income Portfolio A | 1.69 | 7.15 | 1.64 | 2.14 | 2.23 |
| CIBC Managed Income Portfolio A | 1.83 | 7.09 | 2.83 | 2.76 | 1.80 |
| RBC Select Very Conservative Portfolio A | 2.64 | 7.31 | 2.43 | 3.09 | 1.69 |
| Scotia Innova Income Portfolio A | 2.32 | 6.62 | 2.33 | 2.25 | 1.88 |
| TD Comfort Conservative Income Portfolio I | 1.16 | 7.04 | 1.98 | 2.35 | 1.53 |
| Banks Conservative Average | 2.52 | 1.83 |
| Asset Allocation: 60% Fixed Income/40% Equity | 1 yr | 3 yr | 5 yr | 10 yr | Annual fees |
|---|---|---|---|---|---|
| % | % | % | % | % | |
| Justwealth Global Moderate Growth Portfolio | 6.46 | 12.55 | 6.40 | 6.74 | 0.69 |
| BMO SelectTrust Conservative Portfolio A | 3.24 | 9.31 | 3.24 | 3.53 | 2.30 |
| CIBC Managed Income Plus Portfolio A | 3.64 | 8.50 | 4.02 | 3.84 | 2.19 |
| RBC Select Conservative Portfolio A | 5.74 | 10.18 | 4.51 | 4.75 | 1.70 |
| Scotia Innova Balanced Income Portfolio A | 4.05 | 8.40 | 3.63 | 3.42 | 1.99 |
| TD Comfort Balanced Portfolio I | 4.86 | 10.11 | 4.57 | 4.48 | 1.91 |
| Banks Moderate Average | 4.00 | 2.02 |
| Asset Allocation: 40% Fixed Income/60% Equity | 1 yr | 3 yr | 5 yr | 10 yr | Annual fees |
|---|---|---|---|---|---|
| % | % | % | % | % | |
| Justwealth Global Balanced Growth Portfolio | 10.31 | 15.89 | 9.01 | 8.87 | 0.68 |
| BMO SelectTrust Balanced Portfolio A | 6.46 | 12.91 | 5.90 | 5.50 | 2.40 |
| CIBC Managed Balanced Portfolio | 6.30 | 11.20 | 5.53 | 5.46 | 2.25 |
| RBC Select Balanced Portfolio A | 9.30 | 13.76 | 6.61 | 6.72 | 1.94 |
| Scotia Innova Balanced Growth Portfolio A | 6.68 | 11.14 | 5.38 | 4.99 | 2.11 |
| TD Comfort Balanced Growth Portfolio I | 7.08 | 12.06 | 6.24 | 5.63 | 2.02 |
| Banks Balanced Average | 5.66 | 2.14 |
| Asset Allocation: 20% Fixed Income/80% Equity | 1 yr | 3 yr | 5 yr | 10 yr | Annual fees |
|---|---|---|---|---|---|
| % | % | % | % | % | |
| Justwealth Global High Growth Portfolio | 14.85 | 19.04 | 11.09 | 10.32 | 0.64 |
| BMO SelectTrust Growth Portfolio A | 10.24 | 16.63 | 8.53 | 7.61 | 2.50 |
| CIBC Managed Growth Portfolio A | 11.00 | 15.09 | 8.04 | 7.87 | 2.46 |
| RBC Select Growth Portfolio A | 12.45 | 16.24 | 8.23 | 8.11 | 2.03 |
| Scotia Innova Growth Portfolio A | 9.14 | 13.55 | 6.94 | 6.29 | 2.21 |
| TD Comfort Growth Portfolio I | 10.31 | 14.86 | 8.68 | 7.28 | 2.13 |
| Banks Aggressive Average | 7.43 | 2.27 |
| Asset Allocation: 100% Equity | 1 yr | 3 yr | 5 yr | 10 yr | Annual fees |
|---|---|---|---|---|---|
| % | % | % | % | % | |
| Justwealth Global Maximum Growth Portfolio | 19.59 | 22.86 | 13.84 | 12.39 | 0.63 |
| BMO SelectTrust Equity Growth Portfolio A | 12.69 | 19.14 | 10.60 | 9.29 | 2.61 |
| CIBC Managed Growth Plus Portfolio A | 11.82 | 15.80 | 8.29 | 8.45 | 2.48 |
| RBC Select Aggressive Growth Portfolio A | 17.29 | 20.83 | 11.44 | 10.50 | 2.13 |
| Scotia Innova Maximum Growth Portfolio A | 10.57 | 15.26 | 8.06 | 7.30 | 2.33 |
| TD Comfort Aggressive Growth Portfolio I | 12.94 | 17.43 | 10.79 | 8.78 | 2.23 |
| Banks Maximum Average | 8.86 | 2.36 |
Swipe table →
Data as of Sept 30, 2026
Source: Morningstar Direct
* The information presented above was obtained from sources which we believe to be reliable, but we cannot guarantee the accuracy of the information. The information does not constitute financial, tax, legal or any other kind of advice, nor is it an offer to buy or sell any securities. Rates of return are presented in Canadian dollars, annualized, and are net of the fees indicated. For additional details on the calculation of Justwealth rates of return, please refer to the disclosure on our performance page. Past performance is not a guarantee of future returns.
This analysis is a comparison of the largest mutual fund asset allocation programs offered by each of the 5 largest Canadian banks and Justwealth, an independent, low-cost online Canadian Portfolio Manager. Each program maintains a series of portfolios ranging from low risk to high risk. The categories used in the analysis attempt to compare portfolios with similar allocations to fixed income and equity securities. The five categories and approximate asset allocations are as follows:
Conservative: 80% Fixed Income/20% Equity
Moderate: 60% Fixed Income/40% Equity
Balanced: 40% Fixed Income/60% Equity
Aggressive: 20% Fixed Income/80% Equity
Maximum: 100% Equity
Canadians have invested over $125 Billion in the programs above. It’s time to get “Justice” from your investments!
Ready to Invest?
Want to dig deeper?
View all Justwealth Portfolios
Justwealth – A Recognized Industry Leader

For the third straight year, and the fourth time in the last five years, MoneySense has named Justwealth the Best Overall Robo Advisor in Canada! Justwealth “assigns clients a dedicated advisor to deal with instead of an anonymous help desk. And it has by far the widest range of portfolio types—more than 80 of them.”


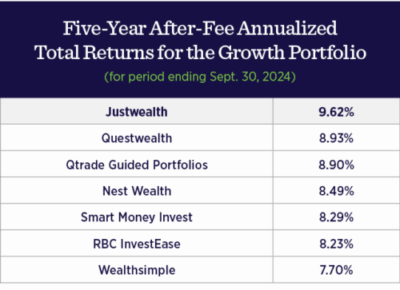
For the fourth straight year, Justwealth had the highest five-year after-fee annualized total returns for the growth portfolio

“Justwealth has consistently delivered the best portfolio returns of any Canadian robo advisor. That performance, paired with the tailored support and hands-off simplicity, is why I still consider them the best robo advisor in Canada.”